Introduction
CubeWeaver is a low code, rapid application development tool for applications with a spreadsheet interface. In a typical scenario a model designer creates a multidimensional spreadsheet (a model) and shares it with users, who fill the model with data. This guide is primarely aimed at model designers, as entering numbers into worksheets is self explanatory.
Creating a model typically involves the following steps:
- Create lists and list items to represent business objects and measures of the model. List items can also be imported from a CSV file or a relational database.
- Create multidimensional cubes using lists from the previous step as its dimensions
- Create formulas to perform computations
- Create worksheets (a 2D views for the cubes) to be shared with end users
- Create cell formatting rules and cell style rules to improve readability of the worksheets
- Use cell visibility rules in combination with buttons to create workflows and advanced functionality (like data import jobs)
Key concepts
- Lists are used to store master data of the model. They are very similar to plain relational tables. List consist of list items. List items can reference each other to form relations between lists.
- Cubes are multidimensional ("n-D") arrays of values. The term comes from data warehouse and OLAP. Lists are used to define dimensions of the cubes. You can find more info on data cubes on wikipedia
- Formulas are rules that are used to perform computations inside of a cube. Each formula has an area of effect, a set of input references and an expression, which specifies the computation.
- Area of effect is a subset of a cube. It is used to specify a set of cells where a certain formula is applied.
- Rules concept is a generalisation of formulas. Rules are objects which modify behaviour and appearance of cells (like formatting, styling and cell visibility rules). All rules have an area of effect to specify where the rule is applied.
- Worksheets are 2D views of the cubes. Worksheets specify which dimensions are displayed as rows and columns and which list items are visible. They can also be used to combine multiple cubes with different dimensionality into a single view.
Lists
Lists represent important business objects for your model. Lists can be understood as normal relational tables of a database.
Some examples of lists are:
- Products with items like: Lemonade, Bubble gum, ...
- Months with items: Jan, Feb, ...
- Geographic locations with items: Berlin, Paris, ...
List items can have attributes attached to them (like if a product is active or discontinued). The attributes are represented as columns in the list view. Attributes are used to control the area of effect of the formulas, create hierarchies or to logically connect items from two different lists.
Important note: Lists and list items should only be used to store master data which does not change often (in contrast to the cube data). Most changes to lists will trigger a full recompute of the model. Formulas which change list items are more complex and less expressive than cube formulas. A good practice is to keep as much data as possible in the cubes and as little as possible in the lists.
Lists can be found under the Lists item of the navigation tree (lower left part of the screen). Click on a list to open it. New lists can be created by clicking on the Lists item of the navigation tree.
A typical list looks like this:
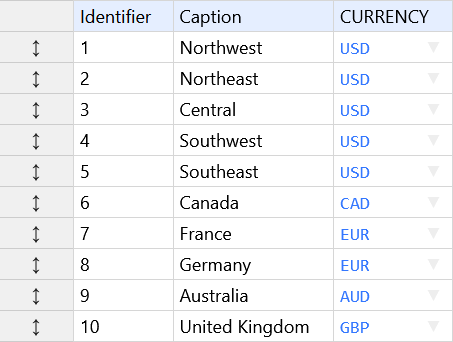
Each list has two mandatory columns: a unique identifier and a caption. Identifier is used to reference the item from a formula or to identify it during data import or export. The identifier can be changed. Latin letters, numbers, underscore(_) are allowed. The caption is an optional text which which is displayed to the user.
A list can have other user-defined columns (or attributes). User-defined columns can point to other list or contain additional data about a list item. Column data can be used in formulas to specify the area of effect or to navigate cubes via references. Column names must be unique across all lists.
Quick access buttons on the left can be used to add or remove items to the list. Use the list menu to create or remove list columns, rename a list and change its settings (like sort and display modes).
Hierarchies
List items can be organized in a hierarchy.
The following steps explain the process of creating a hierarchy:
- Create a list for each level of the hierarchy (f.e.
cityandcountry). - Add a reference attribute to the lower level of the hierarchy which points to the higher level. In our example the
citylist gets a new columnCOUNTRYof typecountry. - Assign values for the new attribute to each list item.
- Use the Hierarchy key column dropdown from the List settings dialog to set up the hierarchy. In our example we select the
COUNTRYcolumn in the Hierarchy key column dropdown of thecitylist.
After following the above steps the cities will be displayed as a hierarchy tree in all of the worksheets and in the list screen.
Hierarchy settings only affect the way the list items are displayed and not the computations. Formulas use list item attributes directly. This allows aggregation over multiple hierarchies.
Link lists
Link lists form a many-to-many relation between two other lists. As an example a store and product lists form a many-to-many relation, because each store can sell many products and a product can be sold in multiple stores.
The following steps explain the process of creating a link lists for a many-to-many relation:
- Create both base lists first (f.e.
storeandproduct). - Create a list to connect the first two lists. Let's call it
store-productin our example. - Add a reference attribute to the link list which points to the first part of the relation. In our example the
store-productlist gets a new columnSTOREof typestore. - Add a second reference attribute to the link list which points to the second part of the relation. In our example the
store-productlist gets a new columnPRODUCTof typeproduct. - Assign values for the new attributes to each list item of the link list.
- Now select one attribute in the Hierarchy key column dropdown and the other one in the Link key column dropdown from the List settings dialog. In our example we select the
STOREcolumn as the hierarchy key and thePRODUCTcolumn as the link key. - Optionally tick the Autogenerate identifiers and Caption from linked items checkboxes.
After following the above steps the store-product list will be hierarchically organized by store. A user will have to select a product each time he adds an item to this list. The system makes sure that every item in the store-product list has values for both the STORE and the PRODUCT columns (the "not null" constraint is enforced). The system also makes sure that no store has the same product more than once (the uniqueness constraint is enforced).
Link lists can be auto-generated from another relation between the parent and the linked list or using the cross join logic (all possible combinations).
Use the Auto-generate list dropdown from the List settings dialog to enable this feature. A relation between the the parent and the linked list is required. Check out the Year-Quarter-Month list from the best practices page or the Store-Product list from the Sales planning sample model to see how this feature works.
Warning: The list items will be completely managed by the system, if the auto-generation feature is enabled. The user will not be able to add or remove items manually. Already existing items (including references to them) will be deleted without a warning if they do not exist in the selected relation.
Cubes
Cubes are multidimensional ("n-D") arrays of values, which are used to store the bulk of the data. Formulas and formatting rules are attached to cubes.
Cubes are only visible to model designers. End users can view and edit selected cube values via worksheets.
A dimension can be seen as an abstraction of the row and column concepts. We use lists to represent dimensions. List items are used to label single rows or columns the same way numbers and letters are used to label rows and columns in a plain spreadsheet.
A new cube can be created using the Cubes → New cube menu item from the navigation tree. You will be asked for a set of lists to be used as cube's dimensions. Dimensions can also be added or removed at a later time with the Add/Remove dimension menu items.
Dimensions of a cube can be displayed as rows, columns or filters. The layout of the cube can be changed via the "Change layout" menu item.
Rules and formulas
Rules are objects which modify behaviour and appearance of cells. Rules are always attached to a range of cube cells. A formula, for example, is a rule that makes a range of cells readonly and automatically computes their values.
Following kinds of rules are available in CubeWeaver:
- Formulas to produce computed cells
- Cell formatting rules to format ranges of cells
- Cell style rules to change the appearence of cells
- Cell visibility rules to hide cells or make them readonly
All kinds of rules can use formula expressions to specify the desired behaviour. A dynamic style formula, for example, uses style_... functions to specify appearence of a cell. Some rules can be used in a static mode. A static cell style rule will apply the same style to all affected cells. A user can switch between the static and dynamic modes using the dynamic (use formula) checkbox on the right side of the formula editor.
Another important aspect that all rules have in common is the area of effect concept:
A major drawback of a common spreadsheet is the necessity to copy formulas and cell formats as new cells are added. This happends because formulas are normally bound to individual cells. We remove this limitation using the area of effect concept to express the part of a cube a rule is applied to. The 'area of effect' defines a set of list items a formula is applied to for each dimension of a cube. The area of effect can be expressed in a flexible way, so that a formula can be applied to all list items, to a fixed subset, to all but selected items or to items with certain attributes. This way a formula will continue to do its job as new items are added to the cube's dimension lists.
Formulas
Formulas are used to compute cells of a cube based on the content of other cells. Right click on a cell and choose New formula menu item to create a new formula. The formula editor overlay will appear.
The formula syntax is quite similar to common spreadsheet application. A CubeWeaver formula can span multiple lines and contain C-style comments (like: /* this is a comment */)
Some other additions and new concepts are documented in the following chapters:
Cell references
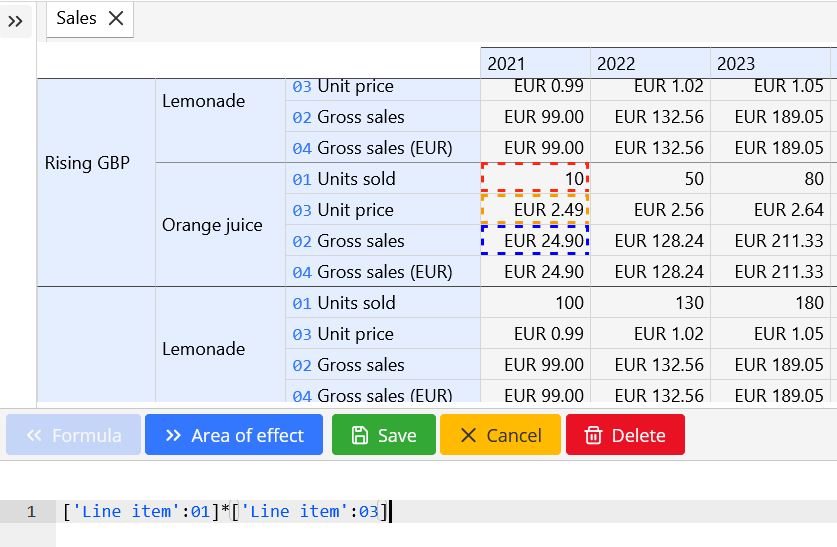
The unique multidimensional cell reference syntax makes formulas very powerful and durable. The easies way to add a cell reference is to select a cell range with a mouse while the formula editor is active. The reference will be added to the current cursor position. While this may be enough for most of the basic cases it is important to understand how cell references work.
Cells can be accessed statically using list item identifiers, dynamically based on the order of the list items (previous, next) and dynamically based on relations between list items (through attributes).
Here is an example of a cell reference: ['List A':3, Year.prev()]
A cell reference is a comma separated list of directives which is enclosed in square brackets. Each directive defines the targeted list item(s) along a single dimension. There are two types of directives: static and dynamic.
Static directives refer to a fixed set of list items, no matter which list item is being computed. Following syntax is supported:
<list id>:<list item id>: Refers to a single item. Example:'List A':3refers to an item with the id3inside'List A'.<list id>:(<list item id1>, <list item id2>, ...): Refers to a fixed set of list items. Example:'List A':(33,57,73)refers to items with the ids33,57,73inside'List A'.<list id>:(<list item id1>:<list item id2>): Refers to a range of list items betweenlist item1andlist item2(inclusive). Example:'List A':(33:57).<list id>:*: Refers to all items of the list. Example:'List A':*
A dynamic directive has the form <source list id>.<function>(<parameters>). The directive Year.prev() uses the function prev() which will refer to the list item located just before the list item which is currently beeing computed.
Below is the complete list of the functions for dynamic references:
next(),prev(): functions will return the next or previous item in the list orderoffset(<index>, <window size>)function is a generalisation of thenextandprevfunctions. It will select a continuous range ofwindow sizelist items that startsindexitems before or after the current item. Ifindexis negative the range will start before the current item. Ifwindow sizeis negative the selection window will go backwards and the items will be selected in the reverse order. Examples:YEAR.offset(1,2)will select years 2021, 2022 if the current year is 2020YEAR.offset(-1,-3)will select years 2019, 2018, 2017 if the current year is 2020YEAR.offset(-1,3)will select years 2019, 2020, 2021 if the current year is 2020
all()function will return all the items of a listjoin(<list id>,<attribute_name>)function will return the items of the listlist idassociated with the source list via the columnattribute_name. If the optional parameterattribute_nameis missing the first reference attribute of the respective type will be used. This function is mostly used when accessing cells from a different cube based on a relation. Examples:sum('Sheet 2'.[Region.join(Country)])- will sum up all the cells from cubeSheet 2which are associated with the current region'Sheet 1'.[Country.join(Region),Measures:02]- will lookup the cell corresponding to the region of the current country from cubeSheet 1
joinris the same asjoin, but will force attribute traversal in the reverese order. Useful only when an attribute connects a list to itself in a parent/child relation.
A cell from a different cube can be referenced by prepending a cell reference with the cube's identifier: 'Sheet 2'.['List A':3].
Identifiers containing spaces or non-latin letters must be quoted: 'Sheet 2'.['List A':3] or 'Лист 1'.['Продукт':3].
Conditions
Functions like sumif or countif expect a condition as one of the arguments. CubeWeaver variants of these functions accept a boolean conditional expression instead of a fixed value. The cell value can be referenced using the $cell variable inside these conditions. $cell returns a cell object, which can directly be used for computations (like $cell + 2 > 3). It can also be used to access cell dimensions like $cell.YEAR (returns a list item).
Some examples are:
sumif([Measures:03, Year.all()], value($cell.Year) > [Measures:04])- sumMeasures:3for years greater than the value stored in[Measures:4]countif([Measures:03, Year.all()], and($cell > 3, $cell < 6))- count all values between 3 and 6
Functions that apply a condition to a value and not to a cell directly (like validate) use the $value variable. $value returns a number and can only be used for computations (like $value > 34). Example:
validate([Measures:03] - [Measures:04], $value > 0, "positive result expected")- compute the cell as[Measures:3] - [Measures:4]and display an error if the result is negative
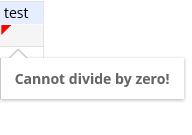
Formula errors
Each computed cell is either valid or invalid. Invalid cells are marked with a red triangle at the top left corner. Placing the mouse over an invalid cell will show an error message:
Validation state of cells is propagated over the computations. This means that any computed cell which references invalid cells will also become invalid with an error message: "Error in a precedent cell(s)". This way any error which occurs in cubes on a lower level of hierarcy will be visible in aggregated cells on higher levels.
The validate(<value>, <condition>, <message>) function can be used to mark a cell invalid based on a boolean condition. The value parameter is the result of the computation and will be returned by the validate function unchanged. The condition is a boolean condition which must be true for the cell to remain valid. The message is an error message for the invalid cells. The validate function can be chained to check for multiple conditions.
Example:
validate([Measures:01]-[Measures:02], $value <= 5, "the difference must be less than 5")- will compute the current cell as[Measures:01]-[Measures:02]and mark it invalid if the result is greater than 5validate(validate([Measures:01]-[Measures:02], $value <= 5, "the difference must be less than 5"), $value>=0, "the result must be positive")- will compute the current cell as[Measures:01]-[Measures:02]and mark it invalid if the result is greater than 5 or less than 0
User-defined functions
Functions for CubeWeaver can be written in any .NET language (like C# or VB.NET). To add new functions a .NET Core assembly with functions implementation must be added to the CubeWeaver directory. Following conventions must be met:
- The assembly name must start with
functions_. For example:functions_math.dll. - The assembly must contain at least one static class called
FunctionLibrary. All public static methods of this class will be added to the function library. - Function parameters and return value types must be one of the following:
decimal- numberIEnumberable<decimal>- cell rangestring- stringbool- booleanFunc<decimal, bool>- boolean condition
System.ComponentModel.Descriptionattribute can be used to add context help to a function. Three slashes (///) are used to separate the description text and the example text. For example:[Description("Square sum///sqsum([A:(1,2,3)])")]
The function names will be prepended with an ext_ prefix to avoid conflicts with the standard functions (gcd(a,b) static method will be mapped to ext_gcd(a,b)).
A sample implementation is available on GitHub.
Cell formatting rules
A formatting rule changes the format for a range of cells. A formatting rule can be created by right clicking on a cell and selecting the Format cell menu item.
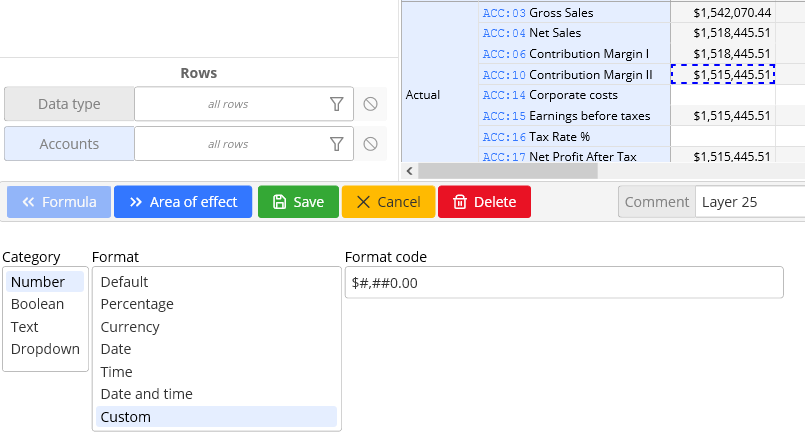
Possible cell formats are:
- Number: a numeric/date/time cell with standard spreadsheet cell formatting syntax
- Boolean: a checkbox for switching the value between 0 and 1
- Text: a text comment string which cannot be used in formulas
- Dropdown: a dropdown with list items as options. Values are accessible from formulas using the
element(range)function. - Slider: only accessible using the
formatrange(min, max, step)function - Button: only accessible using the
formatbutton(...)function
Cell format can either be defined statically, by selecting a respective option in a listbox or dynamically with a formula by checking the dynamic checkbox on the right side of the screen. A dynamic formatting formula must return a format object, which can be created using one the format...() functions. Some format types (like buttons and sliders) are only available through the respective format functions (like formatbutton(...)). See the function docs for more information on formatting functions.
Cell styles
Cell style rules specify the appearence of a cell (like text, background, border colors, cell width and allignment, font style). Cell style rules can be created by right clicking on a cell and selecting the Cell style... menu item.
Depending on the state of the dynamic checkbox (on right side of the screen) the rules are either static or dynamic:
- Static style rules specify a static style using fixed values.
- Dynamic color rules specify a style using the
style_*()functions. Style functions can be chained using theand()function.
Multiple style rules are combined using the rule's priority.
All style functions expect standard CSS style syntax. Documentation of the CSS color syntax is available here.
Some examples:
and(style_background_color(if([] >= 0, "green", "red")), style_font_weight("bold"))Red background for negative numbers. Green background for positive numbers. Bold font.style_background_color(concatenate("hsl(50,100%,", text(median([],0,100)), "%)"))The background is yellow with lightness taken from the cell value (between 0 for black and 100 for white).
Note: Standard spreadsheet cell format color syntax (like [red][<100]0;0) is also available using the cell formatting rules.
Buttons and workflows
CubeWeaver cells can be formatted to display a button. A click on a button triggers a single execution of a set of formulas. Buttons can be used to:
- Change editable cube values
- Add, remove or update list items
- Import data from files, databases or any other sources
Buttons can be created using the dynamic cell formatting (context menu → Format cell than check the dynamic checkbox on the right).
The formatbutton(label, updates...) function is used to specify the button parameters. The first parameter is the label for the button.
The button labels can contain additional tags to customize the appearence and functionality of a button. Following tags are supported:
[confirm:<message>]: asks for a confirmation before an operation is started[style:<button style>]: changes the color of the button. Following styles are supported:success- green button,danger- red button,warning- yellow button.[silent]: hides the report, which is normally shown after the operation has been completed successfully.[prompt_file:<file extension>]: let's the user choose a file to be uploaded to the server. Only useful in combination with data import functions likedata_source_csv_uploadordata_source_xlsx_upload.
The second and all subsequent parameters of the formatbutton function are update functions like: update, list_append or import_values.
Cube value updates
A click on the button triggers a single computation of a set of formulas on a designated cell range. The cell range is specified relative to the cell where the button was clicked. Cube value updates can be used for:
- One time bulk changes to input values like increasing a range of input values by a certain percentage or distributing certain costs among input values.
- Copy a range of values from one element to another like rolling forward the planning values from the previous to the next year. Or copying results of a simulation to a certain scenario.
- Workflows (submitting a range of cells): A click on a button changes the content of a cell in a hidden cube from 0 to 1. A cell visibility rule can be used to make a cell range read-only depending on the content of the changed cell. The submit logic can be as complex as needed with multiple submit/approve buttons visible to specific groups of users.
Cube value update is specified using the update(destination, value) function, where destination is a cell range and the value is a formula expression evaluated for each of the destination cells.
Some examples:
formatbutton("[style:success]Submit", update([Account:19], 1))- will display a green button labeled "Submit" which will save the value 1 into the cell[Account:19]relative to the cell where the button was clicked.formatbutton("[confirm:Adjust values?]Apply %", update([Measures:(1,2,3)], [] * (1 + [Measures:4])), update([Measures:4], 0))- will display a button labeled "Apply %" which will change values in cellsMeasures:1,Measures:2,Measures:3by the percentage stored in the cellMeasures:4and delete the value stored in the cellMeasures:4afterwards. The user will see a confirmation dialog with the "Adjust values?" message if he clicks the button.formatbutton("Fill from previous year", update('Sheet 1'.[], [Year.prev()]))- will copy the values from the previous year to the current one (the year where the button was clicked) in the cubeSheet 1. The cube where the button is located must have a year dimension for this to work.
Note: Keep in mind that references in the second argument of the update function are specified relatively to a cell from the first argument and not relatively to the button. If in doubt qualify every cell range with the cube's name.
List item updates
A click on a button can create a new list item (f.e. a new scenario), delete items or generate joins between two list items, which is useful to create lots of items automatically. Following list item update functions are supported:
list_append(list, caption, id, parent, linked_item): appends a new list item to the end of a listlist_delete(items): deletes list items. Items can be referenced relative to the current cell (f.e.list_delete('List A')to delete the current item ofList A) or produced using thefind_item(list, filter)function.list_set_attr(items, attr, value): updates an attribute of for specified list items. Thevalueis evaluated separatly for each item. Current list item can be referenced using the$itemvariable. Example:list_set_attr('Year-Month-Day':*, YMD_DATE, date($item.YMD_YM.YM_YEAR,$item.YMD_YM.YM_MONTH, $item.YMD_DAY))will save a numeric value of the current date into theYMD_DATEcolumn for all list items of theYear-Month-Daylist.list_build_relation(list, condition): auto-generate list items based on a condition. The list must have a parent and a link column to use this function. The$item1and$item2variables are used to reference the parent item and the linked item inside the condition. Example:list_build_relation('Year-Month-Day', day(date($item1.YM_YEAR,$item1.YM_MONTH, $item2)) = $item2)will create the links between months and days, so that only valid dates are available in each month.
Data import
Functions import_values(cube, data_source, single_value_column) and import_items(list, data_source) can be used to import data into cubes and lists. More information is available in the Integrations section.
Cell visibility
A cell visibility rule is used to conditionally hide a cell range or make it read-only. Cell visibility rules can also be used for advanced data access scenarios, when cells are dynamically hidden based on user's privileges or the values of other cells. A cell visibility rule can be created by right clicking on a cell and selecting the Cell visibility menu item.
Cell visibility rules can either be static (always hide the area of effect) or dynamic. A dynamic rule must specify a formula which returns a number as a result. The result is interpreted as follows:
1- hide cell content2- make the cell read only3- make the cell editable4- do not change cell access (can be used in anif()for example)
Worksheets
Worksheets are 2D views of multidimensional cubes. Worksheets specify which dimensions are displayed as rows and columns and which list items are visible. They can also be used to combine multiple cubes with different dimensionality into a single view. Worksheets can also be shared with non-admin users.
The easiest way to create a worksheet is to open a cube and use the "Create a worksheet" menu item. Cube layout will be converted to a new worksheet (which displays that single cube). An empty worksheet can also be created from scratch using the Worksheets → New worksheet menu item of the navigation tree.
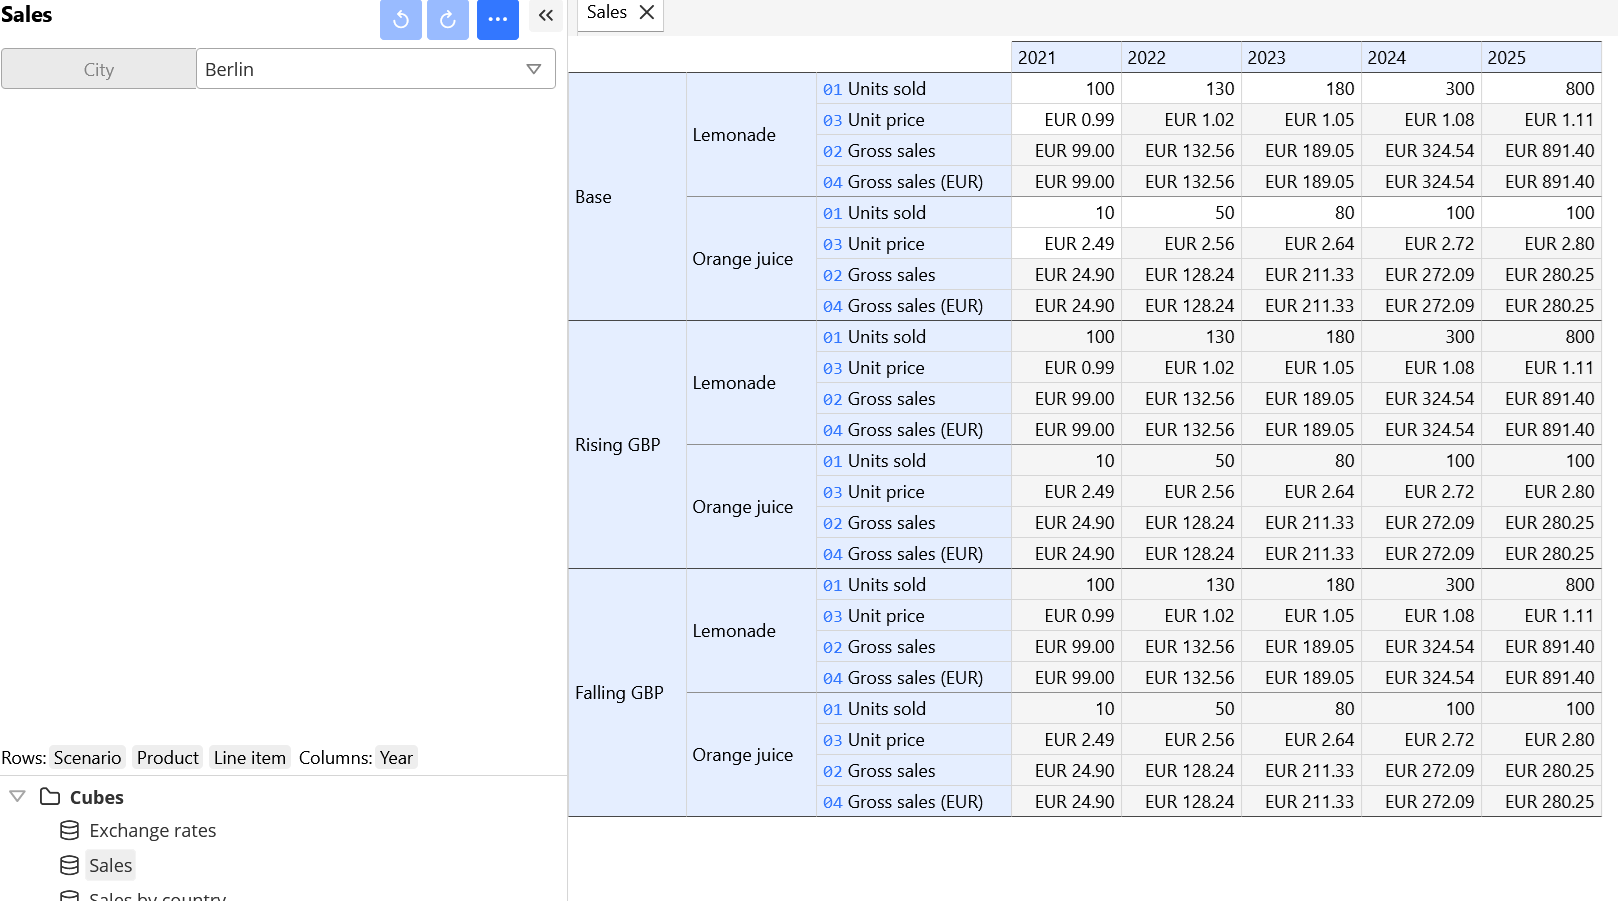
A worksheet can be customized using the Edit menu item. A sample worksheet definition is shown below:
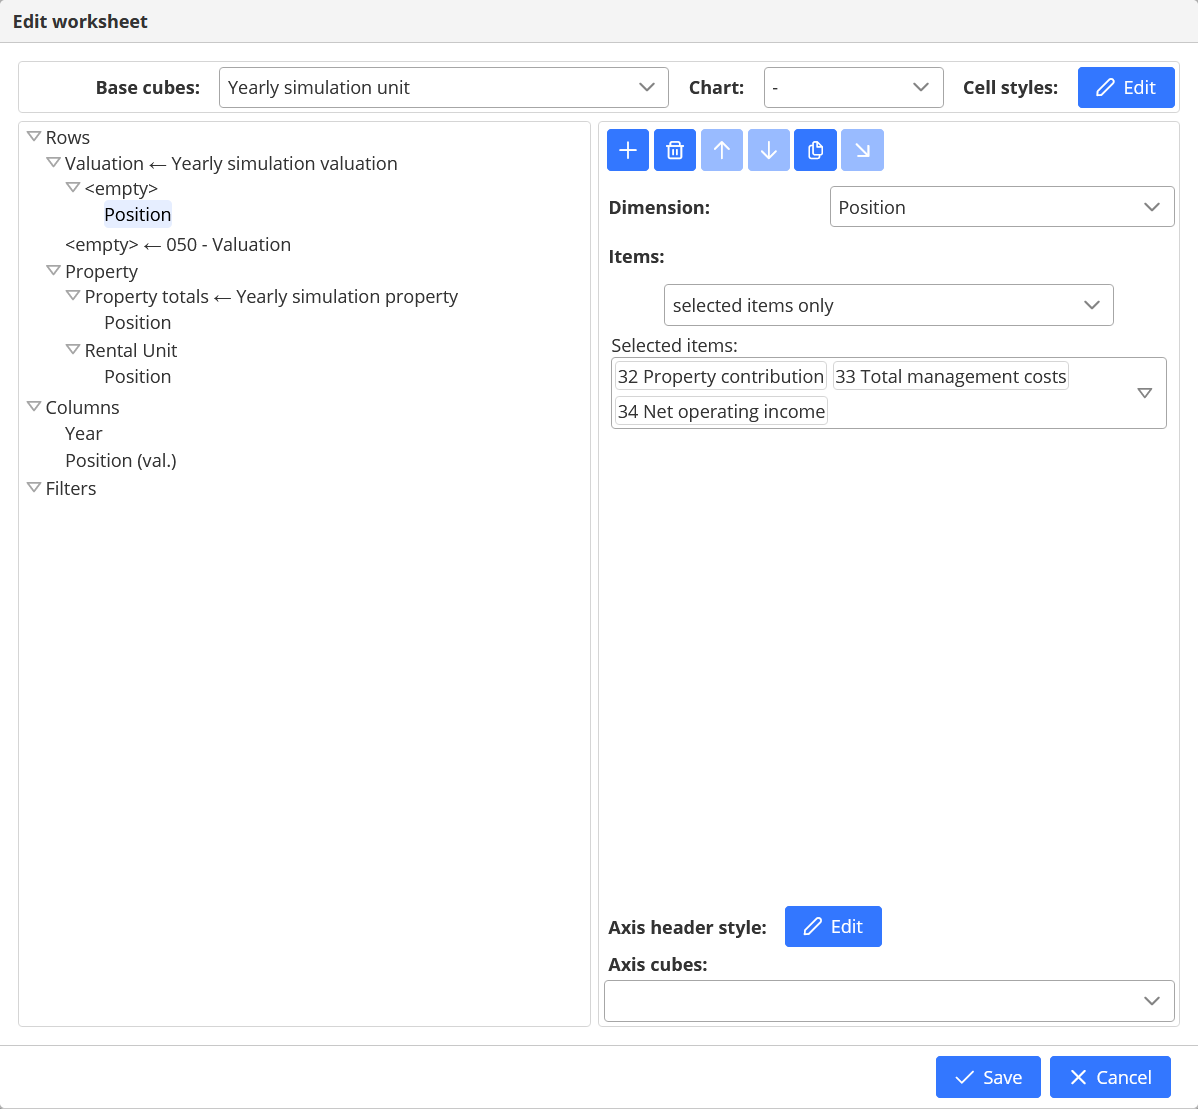
A worksheet is defined by a hierarchy of axis nodes for its rows and columns. There are two kinds of axis nodes: dimension and static. A dimension axis defines a set of elements of a particular dimension. A static axis just displays a static text in the header of the worksheet.
A worksheet will display cells from the cube selected in the "Base cubes" dropdown at the top of the screen. If multiple cubes are selected the following logic applies: each cell will pick the cube with the highest dimensionality for which all the dimensions are available in its axes and filters. This way cubes with lower dimensionality (sums, for example) can be injected as static axes before or after base cubes.
Each axis can override the base cube by setting its own axis cube. In this case the system will show cells from the first cube of the axis hierarchy, for which all the dimensions are available.
A cell will be empty if none of the selected cubes can be satisfied with dimensions. Adding filters for missing dimensions will solve the issue.
Each axis can also define a style for its header cells.
Axis can be moved around using the Cut/Paste buttons of the toolbar.
Two axis nodes organized one below the other in a hierarchy will be converted to a cross product of the elements in a hierarchical worksheet. Two axis situated on the same level will produce elements on the same level of the worksheet.
An example of a complex worksheet can be found in the Property valuation sample model. The "Valuation" worksheet combines data from 4 different cubes. Another example is the Project management model, Timesheets worksheet.
Charts
A worksheet can be turned into a chart by choosing a chart type at the top of the worksheet edit screen. Columns of the worksheet will become the series of the chart. Series properties like color, line style and labels are controlled via the formatting of the header cell of the corresponding column. The Axis header style button can be used to set properties on all the columns of an axis. Style of individual column items can be controlled via the Header style... rules, accessible from the context menu of the corresponding header cell.
Share a model
Models can be filled with data by multiple users simultaneously. Perform the following steps to share your model:
- Click File → Share menu item to open the sharing dialog.
- Create a new share with Share by link or Share with user buttons.
- Use the Share by link button to create a share which is accessible anonymously by anyone in possession of a secret link.
- Use the Share with user button to share the data with a single registered user. You will be asked for the user's login. Please make sure that the login is typed correctly. The user will NOT be notified by the system. Please notify the user manually.
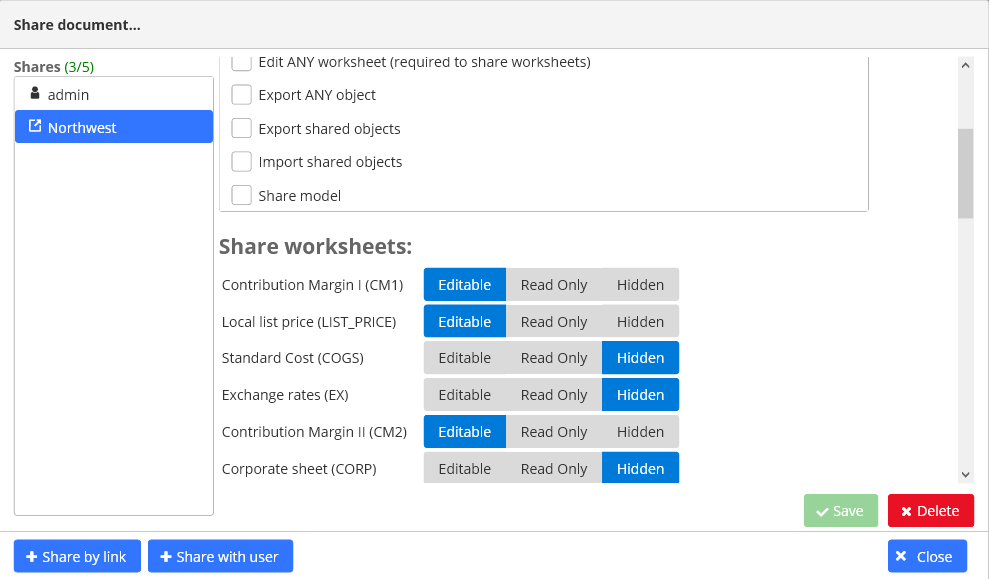
- Share settings will appear on the screen. Go through the following steps to select which parts of the model should be shared:
- Select the system privileges: System privileges are required to perform special tasks like exporting data or sharing the model with others. Certain privileges let users access all worksheet or all lists.
- Select the worksheets the user can access. You can share a worksheet in read-only or editable mode.
- Select additional worksheet access limits for each dimension if necessary. Setting this option will limit worksheet access to certain list items.
- Select which lists should be shared with the user. You can share a list in read-only or editable mode.
Integrations
CubeWeaver can be integrated with various 3rd party spreadsheet and database systems via open protocols and data formats like: .CSV, .XLSX, ADO.NET, REST and ODATA. A developer API is available for advanced scenarios.
Excel VBA Macro functions
Cube and list data can be accessed via VBA functions from Excel.
VBA code is hosted on Github. The Module1.bas file contains the user defined functions. ThisWorkbook.cls contains optional event handlers to automatically send updated cell values back to the server and update cell dependencies. Just copy and paste the code into your worksheet to start using the UDFs. VBA functions use CubeWeaver public API, so feel free to use the code to create custom functions for other spreadsheet applications.
Function documentation:
cw_cell(url, cube, coords...)- fetches a single cell from the CubeWeaver server.urlis the API URL (create using File → Share → Share by link).cubeis the name of the cube. Remaining arguments are pairs dimension coordinates in the formlist id, list item id. Example:=CW_CELL("http://localhost:8080/api/AJLJIXUQNKXAV4ZPO56PHNMKYLBK355G.68XKOISWELPYYT2LBN82YS7UYJRX88GB/";"Cube 1";"List A"; "1";"Line item"; "01"). If optional event handlers are installed, updates to cell value will be pushed back to the server.cw_update_cell(value, url, cube, coords...)- updates a single cell on the CubeWeaver server and returns the new value.valueis the value to send to the server. All other arguments are the same ascw_cellarguments.cw_update_cell_if(condition, value, url, cube, coords...)- same ascw_update_cell, but will only update if theconditionis true.cw_list(url, list, Optional parent)- is an array formula that will fetch ids and names of list items and spill them to worksheet cells. The function returns items as rows. Use theTRANSPOSEfunction to get columns.listargument is the name of the list.parentis an optional parent id. If specified only children of the parent list item will be returned.
Spreadsheet export
Worksheets can be exported to a spreadsheet .XLSX file using the File → Export as .XLSX menu option. All filters of a worksheet will be converted to rows of a spreadsheet file.
The formulas will be translated to standard Excel formulas. Non-standard spreadsheet functions will produce errors in cells of the exported file. Don't use CubeWeaver-specific functions with variables (like with or sumif([], $cell > 3)) if you would like to export the model to Excel.
Only formatting for the standard numberic/date/time cells can be exported correctly. Buttons, dropdowns and other interactive elements are not supported by Excel.
CubeWeaver does not yet validate the number format strings. Invalid format strings can produce errors when opening the Excel file.
ODATA export
ODATA protocol can be used to export model data to 3rd party tools like dashboards or databases.
To export data via the ODATA protocol create a new link-based share (File → Share → Share by link), check the Export any table user privilege and save the share. Click the Show API/ODATA links button to display the ODATA access urls and password.
Data export (row based)
Use the File → Export data menu item to export data in a relational form as a .CSV or .XLSX file.
There are two options to export data:
- denormalized: list item data and cube values are combined into a single table
- normalized: list items and cubes are exported into separate sheets/files
When Measures on columns checkbox is checked a separate column will be created for each measure in the cube. If the checkbox is unchecked all the measures will end up in a single VALUE column and a separate Measure column will designate the measure.
Data import (row based)
Data import functionality is based on formulas and buttons. Please read the respective sections of the documentation first.
List items and cubes data must be imported in a separate steps. Each hierarchy level of a hierarchical list must also be imported separately.
In a typcial scenario a helper worksheet with buttons is created to perform recurring data import operations. A button will execute either the import_values or the import_items function in combination with an appropriate data_source_... function. Here is an example: formatbutton("[prompt_file:.xlsx]import values", import_values('Sheet 1', data_source_xlsx_upload("Sheet 1"))).
- The
formatbuttonfunction creates a button. Button text (import values) is specified in the first parameter. The[prompt_file:.xlsx]tag will prompt the user for an.xlsxfile. - The
import_values functionperforms the actual import operation. The first argument is the destination cube. The second argument is the data source. - The
data_source_xlsx_uploadfunction creates a data source from an .XLSX file. The first parameter specifies the name of the source sheet inside the workbook.
Data sources
Data source is an object which carries tabular data with a header. The header must satisfy a naming convention for the system to know how the data should be imported. Various data_source_... functions are used to create data sources. Some examples:
data_source_csv_upload(delimiter, encoding, header, skip_lines)- constructs a data source from an uploaded .CSV file. Columns can be rename using theheaderargument (comma separated list of column headers is expected).skip_linesargument can be used to skip a certain number of lines at the beginning of the file.data_source_csv_file(path, delimiter, encoding, header, skip_lines)- constructs a data source from a .CSV file on a local files system.data_source_mysql(connection_string, select)- constructs a data source from a MySQL database query. More info on the connection string syntax can be found here.data_source_ado(driver_dll_path, connection_string, select)- constructs a data source from a generic database query. This function can be used to import data from any relational database via an ADO.NET driver. The path to the ADO.NET driver dll on the local file system is supplied as the first argument.data_source_json_http(url, http_header, base_path, columns...)- constructs a data source from a JSON file return by an HTTP GET request. This function can be used to import data from web applications like Airtable via a REST API. Thebase_pathargument specifies the JSONPath expression used to find the records inside the JSON file. Thecolumnsmust be have the format<column name>=<JSONPath>with JSONPath specified relative to the record.data_source_map(source, header, expressions...)- transforms a data source. This function can be used to parse dates or do other transformations. The second parameter is a comma separated list of column headers. Anexpressionreturning a string is expected for each column of the header. The expressions can reference the values from the original data source using thefield(field_name)function.
Some examples below:
data_source_json_http("https://api.airtable.com/v0/APP_ID/Orders?api_key=API_KEY", "",
  "$.records[*]",
  "product_id=$.fields.product_id[0]",
  "value_03=$.fields.['delivery date'][0]",
  "value_02=$.fields.['unit price']")

data_source_ado("Npgsql.dll", [Measures:01], "select * from pg_catalog.pg_tables")

data_source_mysql("server=localhost;user=root;password=", "
  USE adventureworks;
  SELECT REPLACE(p.ProductNumber, '-', '_') LIST_B_ID,  p.Name LIST_B_LABEL
  from product p
  join productsubcategory psc on p.ProductSubcategoryID = psc.ProductSubcategoryID
  join productcategory pc ON  pc.ProductCategoryID = psc.ProductCategoryID
  join productmodel pm on pm.ProductModelID = p.ProductModelID
  where p.ProductNumber like 'BK%';")

data_source_map(data_source_csv_file("orders.csv", char(9)),
  "year,month,day",
  year(datevalue(field("value_03"))),
  month(datevalue(field("value_03"))),
  day(datevalue(field("value_03")))
  )
NOTE: The print(value) function can be used to examine the content of a data source before starting an actual import process.
NOTE: User-defined data source functions can be created the same way as any other user-defined functions (check out the docs above). A data source function must return an IEnumerable<string[]>. The first string array returned by the IEnumerable is interpreted as the header. All subsequent arrays are interpreted as records. All string arrays must be of the same size.
NOTE: Most data_source_... functions are not available in the online CubeWeaver demo to prevent misuse.
Column naming convention
The header of a data source is used to control the import process. Following convention is used:
- The list id column must be named
<list name>_ID. - The list caption column must be named
<list name>_LABEL. - The value column must be named
VALUE, if the measure id is supplied in a separate column. - The value column must be named
VALUE_<measure id>, if the measure id is not supplied in a separate column.
The <list name> placeholder can only contain alphanumeric charecters and underscores. All other symbols must be replaced with underscores. The id of List A would be designated as LIST_A_ID.
NOTE: The easies way to find the right column names for your objects is to perfrom a normalized export using the File → Export data menu item.
For list items, at least the identifier or the caption column is mandatory. If the identifier column is missing the caption is used instead of the id to identify rows. For cube values an identifier or a caption column for each dimension of the cube is mandatory.
Developer API
Developer REST API lets you transfer the data between CubeWeaver and 3rd party systems. Developer API key and an access URL is created automtically when a link-based share is created (see ODATA export for more info). At least export or import privileges are requiered to access the data via the API. Following methods are available at the moment:
Data import:
Following methods expect a valid CSV file to be uploaded with a POST request. The CSV file must have a header in the first line with column names exactly matching the column names found in the import dialog or in an exported file. Some of the columns are optional. For example a column with header PRODUCT_ID is an identifier column for the list with the id PRODUCT. The easiest way to create a valid file is to use a file obtained from an export call as a template.
api/{model_id}/import_values/{cube_id}- import cube values for a cube with the idcube_idapi/{model_id}/import_metadata/{list_id}- import list items for a list with the idlist_id
Example:
curl -L -u ACCESS_KEY: -F "test=@test.csv" "https://cubeweaver.com/api/MODEL_ID/import_metadata/LIST_ID"
Data export:
Following methods can be used to export CubeWeaver data as a CSV file.
api/{model_id}/export_values/{cube_id}- export cube values for a cube with the idcube_idapi/{model_id}/export_metadata/{list_id}- export list items for a list with the idlist_idapi/{model_id}/export_full- export the complete model (all lists and cubes) as a ZIP archive
Example:
curl -L -u ACCESS_KEY: -o test.csv "https://cubeweaver.com/api/MODEL_ID/export_metadata/LIST_ID"
Some examples of API usage (with Python and Pentaho ETL) are available on GitHub.
Note: the CubeWeaver demo website will redirect API requests. That is why the -L key is needed for the curl command. On-premise installation does not have this behavior, so the -L key can be removed.
Note: SSL certificate validation can fail (primarely on Windows) if the certificate store for the curl command has not been setup correctly. The -k key can be used to skip the certificate validation.
Note: Please contact support if you feel like your scenario is not covered by the available API.
Hosting on-premises
Installation
Cubeweaver is a web application. The server packages available for download contain prebuilt binaries and all the required dependecies. CubeWeaver.exe (or CubeWeaver on Linux) is the main executable file. A local web server and a browser window will be started automatically if you start CubeWeaver without parameters.
We recommend using Docker to host CubeWeaver on Linux. Sample docker-compose files and a readme.txt with explanations are available inside the linux archive. At least the --remote option is required to make the server accessible from remote hosts.
The following command line parameters are available:
--db-type (Default: sqlite) Database type to use. Currently supported: 'sqlite' or 'mysql'
--db-conn ADO.NET database connection string. For example: 'Data Source=c:\mydb.db;'
-p, --port (Default: 8080) HTTP server port. Must be reserved manually under windows via the netsh utility.
-b, --base Base url for the web interface (when hosting behind a reverse-proxy).
--db-name Optional database name for mysql database.
--ssl-cert-file Server certificate file in PKCS12 (PFX) format.
--ssl-cert-pass Server certificate file password.
--remote (Default: false) Allow remote access (don't forget to open the port in your firewall).
--no-browser (Default: false) Don't start the browser.
--maintenance (Default: false) Allow remote access to (encrypted) log files.
--import-model Import a model file and exit.
--user Owner for the import operation.
--help Display this help screen.
--version Display version information.
User administration
A built-in admin user is created when the system starts for the first time. Admin's password must be changed before the first login. On linux the admin's initial password is logged by the server on every start until it has been changed. Check the readme.txt for instructions on how to access the log.
Other users can be added using Tools → Manage user accounts menu item. Click the New button to add a user account. The accounts initial password will be displayed at the top of the screen until it has been changed by the user. The password can be reset by an administrator using the Reset password button.
A user can have following privileges on the server (apart from access right he will get on individual models):
- Create models: create new models on the server
- Manage user accounts: create or delete other user accounts and reset their passwords
Troubleshooting
Below is a list of common error messages and pitfalls with explanations on how to solve them:
Error messages
Cannot delete item(s) X. Following items still reference it: A, B, C: A list at the end of the error message contains objects which still reference the item to be deleted. Those references must be removed first. Here is a list with preconditions, for deleting an object:
- List item: to delete a list item it must be remove from all the formulas which reference it first. The list item must not be referenced by other list items via a
Reference-type column.
- List item: to delete a list item it must be remove from all the formulas which reference it first. The list item must not be referenced by other list items via a
A formula must reference cells: This limitation is introduced to efficiently evaluate formulas in very large sparse cubes. Each cell is either an input cell or a computed one. Computed cells must reference other non-empty cells to produce a non-zero result. Formulas without cell references are prohibited completely. In certain cases cell range references may return 0 cells (f.e.
[MONTH.prev()]if the first month is computed). A formula which effectively references 0 cells (like[MONTH.prev()] + 2for January, but NOT[MONTH.prev()] + [Measures:03]) will evaluate to 0. Though this behavior does not impose any limitation in most of the real world scenarios a workaround exists for certain edge cases: reference a non empty input cell and multiply it by zero to ignore it (like[MONTH.prev()] + 2 + 'Sheet 2'.[Measures:11] * 0).